The End of Liquidity and it's Effects on Your Portfolio
Don't Assume This Cycle Is Like the Last Cycle
I am writing this piece realizing that while many will miss it, ignore it, it or simply not grasp its relevance – this is arguably the single most important concept relative to growing and protecting your wealth, and should be the basis of evaluating the strategies you employ to manage your wealth going forward.
Joe Zidle - Chief Investment Strategist of Blackstone Group authored the material I am presenting
Global central banks are about to make the most important shift in policy since the early 90’s, this policy change is relevant to understanding the volatility across portfolio asset classes in the last 12 months: The end of a liquidity cycle is the beginning of a coordinated global tightening cycle.
While it is daunting to think that the days of easy money and the “everything rally” are over, this ending marks the start of a new environment that will come with its own opportunities. The new environment will feature dispersion across asset classes, portfolio performance, companies, and sectors. It will require a different approach than the traditional 60/40 portfolio of stocks and bonds. More broadly, it will require creativity, high conviction investing and a renewed look for uncorrelated assets or tactical strategies designed to adjust risk exposure while navigating future market volatility. If ultra-low interest rates and balance sheet expansion benefited beta strategies, monetary tightening will require more active, selective investing, i.e., alpha, to deliver outperformance.
Don't Assume This Cycle Is Like the Last CycleChina a differentiating factor for inflation this time Moving forward, will rates fall back into the post-recession pattern we’ve seen since 1980, or will they revert to the earlier trend? History says it’s close to a 50/50 proposition, but I think there is reason to believe that the 10-year Treasury yield after the next recession will be higher than it is today.
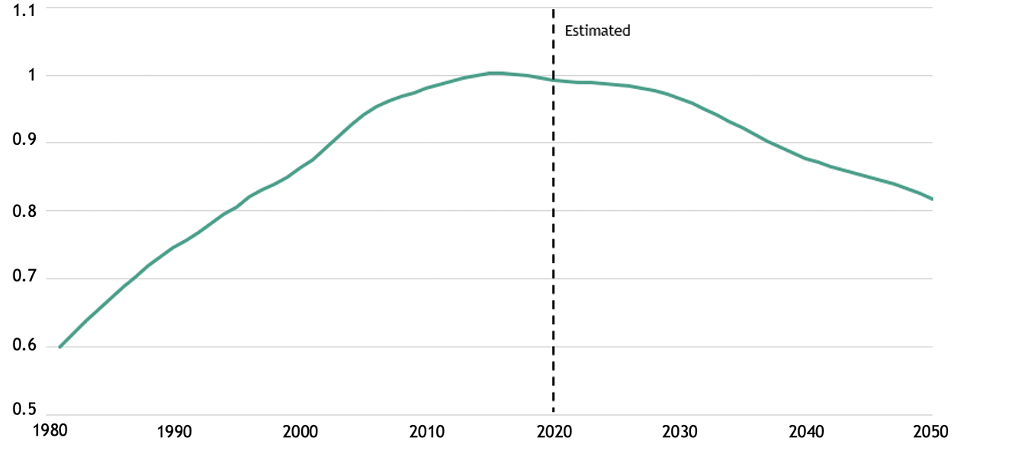
A primary reason for this view is that the underlying inflationary conditions in the US and global economy seem to be more persistent, due in large part to China’s demographics. China is widely credited with driving down prices as its economy grew from low-income to middle income. That leap forward occurred as China benefited from favorable demographics. But a negative replacement ratio and a falling prime age working population fundamentally change China’s role on the manufacturing stage. When China had a labor surplus, it drove costs down. But with its current labor deficit, China’s role as the preeminent low-cost, global manufacturer is being reevaluated.
Figure 1 highlights China’s demographic challenge.
In my view, increased costs in the supply chain, elevated commodity prices that I think could be long-lasting, and widespread labor shortages argue for interest rates to settle at levels structurally higher than the levels of the prior cycle.
Liquidity = Beta
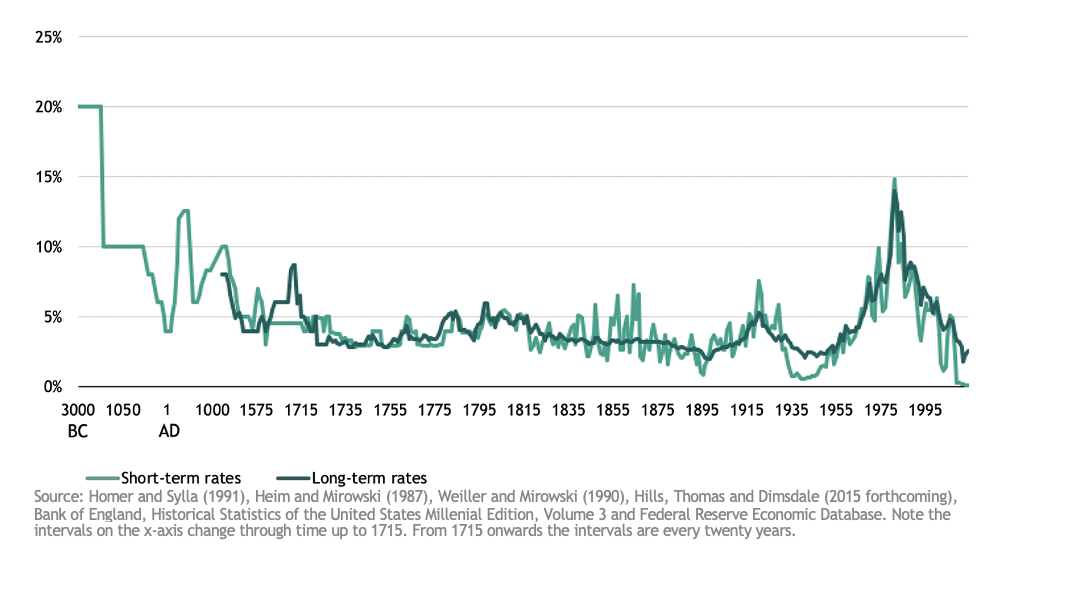
That prior cycle was defined by unprecedented monetary stimulus. As Figures 2 and 3 show, from the end of the Global Financial Crisis in 2009 until now, the combined balance sheets of the Fed, European Central Bank and the Bank of Japan grew from approximately $5.3 trillion to over $23.7 trillion. That persistent central bank accommodation pushed interest rates to a 5,000-year low. Liquidity on that scale provided a massive boost to beta factors.
Figure 2: Central Bank Balance Sheet Assets: federal Reserve, ECB, and BOJ
USD in trillions
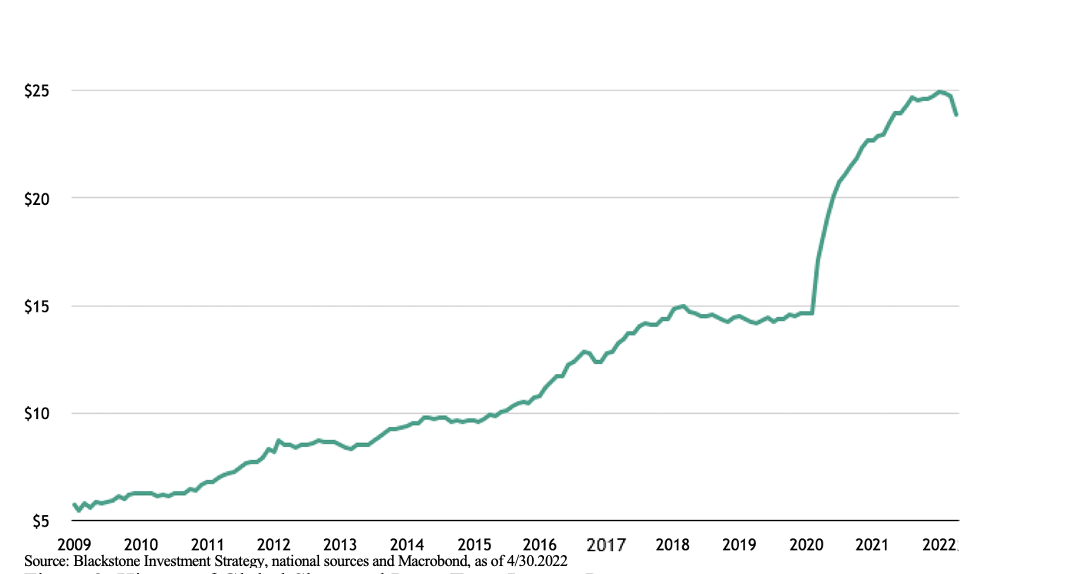
Figure 3: History of Global Short and Long-Term Interest Rates
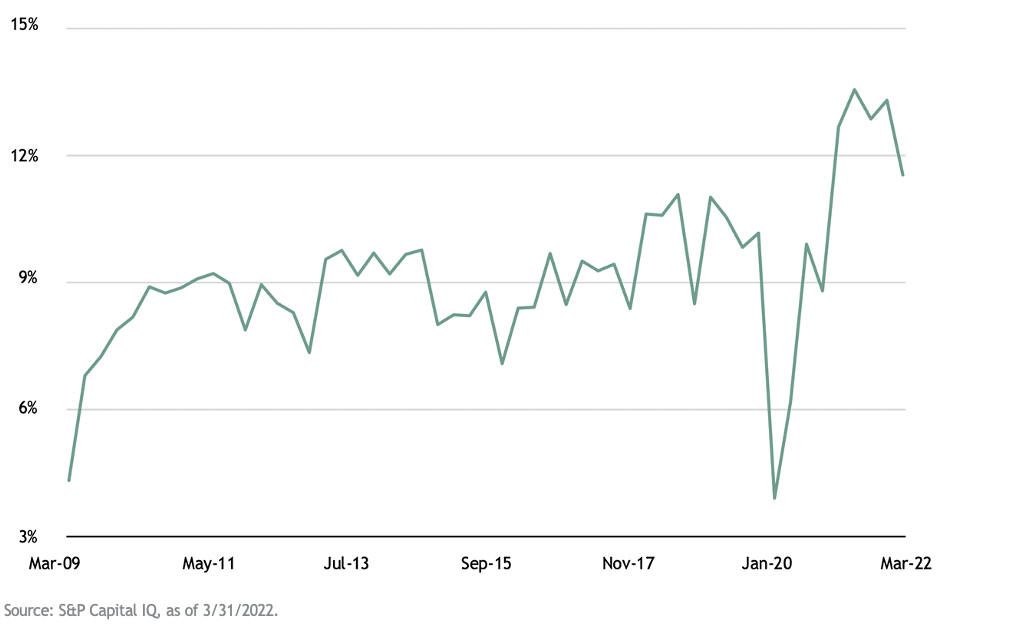
2009–2021: Beta’s stars aligned Record-high profit margins and multiple expansion, fueled by low interest rates, combined to produce the biggest bull market in history. Corporate profit margins increased from 4.3% in the first quarter of 2009 to an all-time high of 13.3% in the fourth quarter of 2021 (see Figure 4).i The amount of money investors in the S&P 500 paid for each dollar of earnings nearly doubled from 12.1x earnings in February 2009 to a multiple of 23x earnings in January 2022.ii Performance followed: the S&P 500 returned over 17% on an annualized basis from February 2009 through January 2022; the Russell 2000 averaged 15% and the Nasdaq an impressive 21%.iii Each index handily beat its historic average returns.
Figure 4: S&P 500 Net Profit Margins
Investors in fixed income enjoyed similarly high returns as a result of these beta factors. The Bloomberg US aggregate bond index benefited from a 40-year bond bull market since inflation last reared its ugly head in the early 1980s. And in the last cycle, liquidity muted corporate bankruptcy risk. Credit spreads narrowed as financial conditions eased. Corporate bond spreads on the safest investment grade bonds peaked at nearly 14% in 1984, before declining steadily over the following decades to a record low 2.0% in July 2020. A traditional portfolio consisting of 60% stocks and 40% bonds returned 10.7% per annum from 2010 through the end of 2021.iv
Tightening = Alpha
Low interest rates and balance sheet expansion created a seemingly unending positive feedback loop for market beta. Good news was good for returns. Bad news was even better. And the worst news of all—a global pandemic—proved the best environment of all for market returns as each recession begot lower rates and easier monetary policy. Now that central banks around the world are on track to hike rates more than 250 times this year while shrinking their balance sheets, those same beta exposures won’t similarly outperform.
Different conditions call for a different mindset
Return assumptions across all asset classes should be dialed back from those of the last cycle. I think a reasonable forward 10-year CAGR assumption for US equity returns is something in the 5% range—around 8% nominal earnings growth. And instead of multiple expansion, we should discount returns for a compression from today’s above-average levels. Interest rates that settle higher than the last couple cycles mean investors in traditional fixed income will be clipping coupons, not enjoying the outsized returns from the secular bond bull market of the past 40 years.
To achieve outperformance, higher conviction investing, and more active management will be needed to make up for returns from beta alone.
Investing in This New Cycle
Investing in good neighborhoods, those companies, and sectors with secular growth tailwinds, will be more important than ever. Free cash flow generation, and a runway to increase it, will be critical as inflation remains a concern for longer. Relying on market beta alone will likely be inadequate to meet many investors’ return expectations. Active management and operational expertise are more likely to drive outperformance than financial engineering alone, and I think investors will benefit from paying a premium for these qualities.
In a fixed income book, this environment will be one in which credit risk is re-introduced as an important consideration. In an era of seemingly unlimited liquidity, the number of non-earning companies skyrocketed, even as credit risk remained historically low. In the face of increased credit risk, senior secured debt and investments that are higher in the capital structure could be well positioned to weather a potential storm. While default rates are still generally expected to be below the historical average in the coming years, I would say that interest rate and credit risk are more evenly balanced than in the past several years. The risk is more skewed to the downside than the upside for both risk factors.
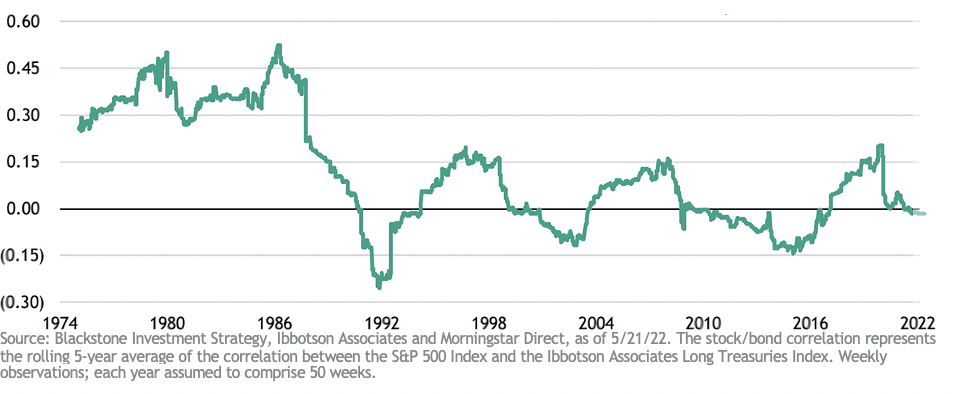
As financial conditions continue to tighten, traditional fixed income may remain positively correlated to stocks. As Figure 5 highlights, the correlation between bonds and stocks is highly variable, depending on the macroeconomic environment. In the late 1970s and the 1980s, they had a strong positive correlation, and since then the relationship has been highly cyclical. Rising interest rates and persistent inflation should prompt investors to reconsider what a “core” portfolio should be.
Figure 5: Stock / Bond Correlation
(Rolling 5 year average
Lastly, I remain of the view that duration risk across all asset classes will be a critical factor in determining performance.
What it means for markets: a new beginning for alpha
The markets were awash in liquidity over the past decade, and the rising tide lifted virtually all financial assets. Now, as the liquidity recedes, we will see which investors were simply riding the wave of beta without any value-add of their own. Divesting from beta-reliant strategies and pivoting towards alpha generation may prove to be a defining driver of outperformance in this cycle.
The cost of money in the financial system literally directly affects or strongly influences every aspect of the capital markets, asset classes, and importantly correlation between asset classes.
Please do not misconstrue my message as a warning that the financial markets are about to crash, quite the contrary for now, we see significant opportunities available today and some which are still developing which were caused by the policy shifts discussed above. That said portfolio strategy for most investors will need to reflect new realities regarding correlation between stocks, bonds, and other asset classes, you should investigate this and understand why a strategy change may be beneficial and how to best execute this.
Time is of the essence here, we see significant opportunities now and dislocations coming next year to both the stock and bond asset classes, preparing for these events now may be one of the most important steps you take in protecting and growing your wealth.
If desired, I am happy to discuss your portfolio and offer my thoughts or a second opinion on your current portfolio strategy.
Be well,
Art Doglione
You might also like